*** Please note the analysis below is not investment advice. The views and opinions expressed here are solely those of the author and do not necessarily reflect the views of U.Today. Every investment and trading move involves risk, you should conduct your own research when making a decision.
Bitcoin is on the “descending triangle”
Over the weekend we moved sideways between the strong areas. Our resistance was the March low at $6,533 and our support was the April low at $6,425. We break downwards from the older counter trendline which is not so remarkable anymore because there are other and newer counter trendlines, but still it could be a small sign.
The weekly candle closes just below the round number at $6,498, so, Bitcoin took down two out of four major resistance levels between the $6,425-$6,533.
Remember we had two weeks ago the "engulfing" candlestick pattern which indicates that we could get another leg down but we didn't. So, this will show us a little bullish hold/momentum on the BTC chart and if you remember, in August, we had a pretty strong monthly candle close (let's say a sloppy "hammer") which could be the reason why we didn't fall further because this monthly candle indicates a little bullishness on the Bitcoin.
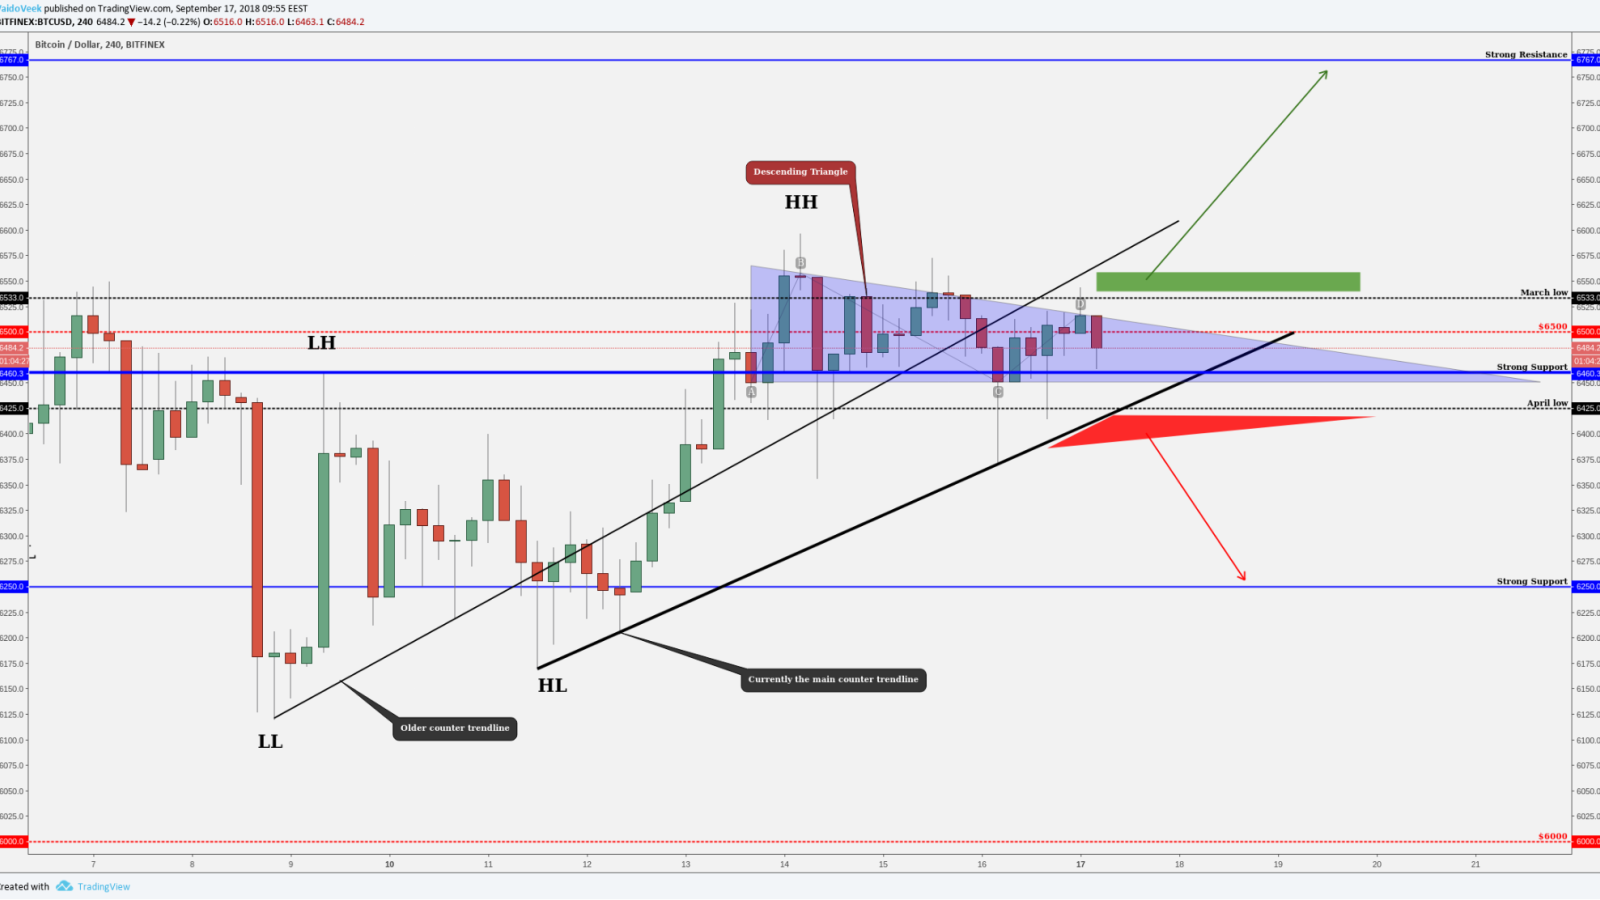
On the four-hour chart, Bitcoin has drawn a bearish chart pattern “descending triangle.” It is pulled from the bodies and soon, it is ready to make a breakout.
The triangle means that we have breakout opportunities to either direction, descending means that we have just a slight advantage to break downwards so, a candle close below the 'currently the main counter trendline' and below the April low level will be a sign that we go downwards (red triangle is the confirmation area). Bullish confirmation would be a candle close above the "descending triangle" and above the March low. Then we got bullish momentum from the chart pattern breakout and if we take down all the major resistance levels from this area then this could be another momentum sign. So, a close above the $6,533 could mean another leg upwards (green box on the chart) and a close below the counter trendline could mean another leg downwards (red triangle).
Ethereum (ETH/USD) has to fight with the trendlines
Overall, the altcoins show us a nice and steady climb upwards which will be a good sign for the whole market. Currently, like Bitcoin, Ethereum has to fight against the strong resistance. The Ethereum price is around $218 and just above us are two trendlines: the longer and smoother since April 1, 2018, and the trendline since July 29 (pulled from bodies). Those trendlines make a cross just above the current price, plus we have a 'naked' resistance area (orange box) and we approaching into the 100 EMA which starts to work as a resistance.
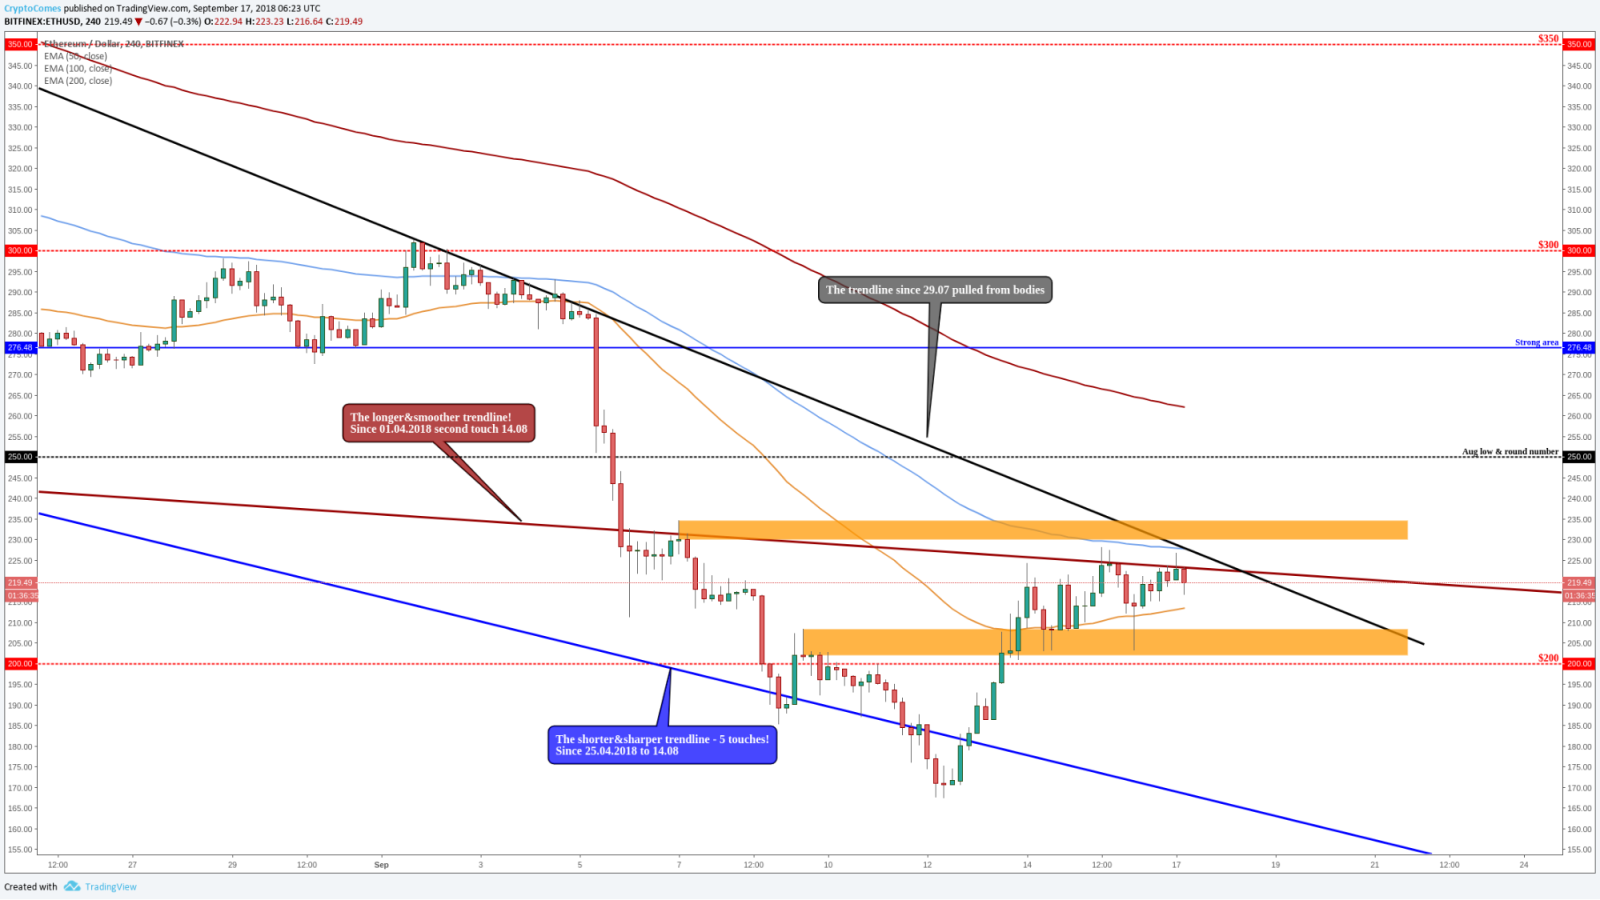
So, after we calculate those criteria we got a pretty significant resistance level. If we want to beat that then Bitcoin definitely has to make a breakout upwards from the triangle then the other altcoins could find the momentum and should follow this move upwards. If we don't catch this momentum then we might go and test the lower levels and the next supports are the orange area below us and the round number $200.
Cardano (ADA/USD) is on the “ascending triangle”
On Friday, we said that Cardano has attempted to break the resistance four times. Now, we have 10(!) failed attempts to break this round number at $0.07. We haven't got a four-hour candle close above the mentioned level so, we can say that this level is pretty significant if we want to see a bullish leg upwards but luckily, we have bullish sings.
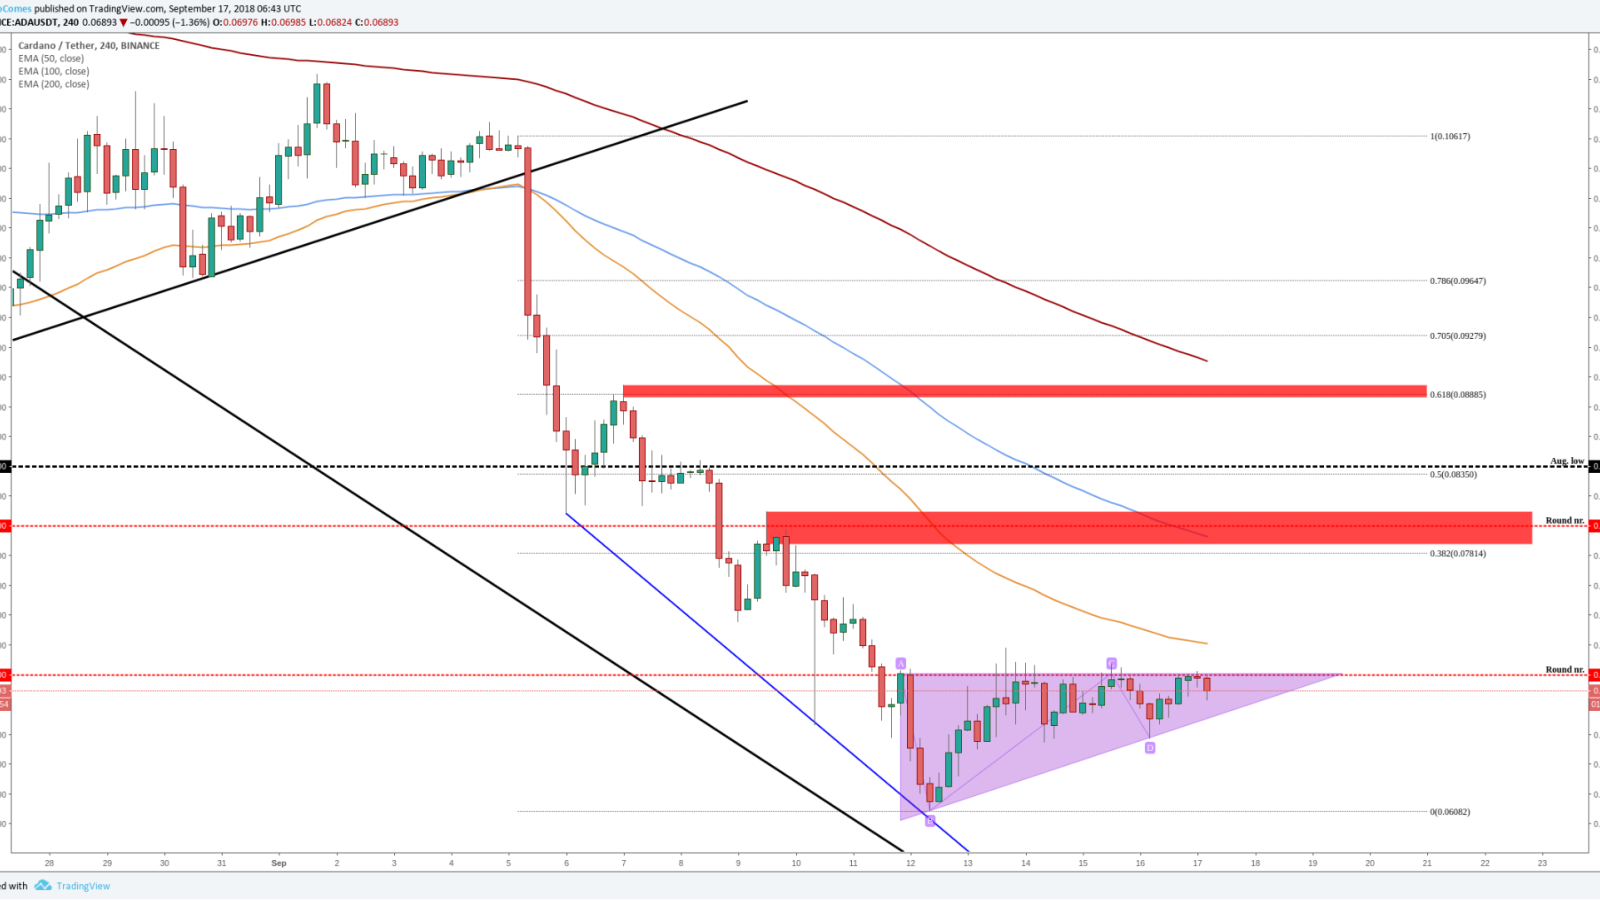
Unlike Bitcoin, the Cardano shows us a bullish chart pattern- "ascending triangle." If we get a candle close above the round number and above the triangle then definitely, we see a nice bullish move because the price is pushed together and ready to explode.
If Cardano breaks this key level then you already know our targets but let's repeat those. Our targets are based on Fibonacci retracement levels (pulled from and previous support levels: Sept. 5th-Sept. 12th):
- Around $0.08- as you see from the current example the round number starts to work as a resistance, in this area, there is also the Fibonacci retracement level of 38 percent and strong support/resistance area (red box).
- Around $0.089- in this area, we have a previously worked resistance level and the perfect Fibonacci retracement level of 62 percent.
If Cardano and the whole market don't find the momentum and if we get a breakout downwards from the triangle then we may go to retest the 'old' support level (from Sept. 12th) at $0.061. To secure your portfolio the selling sign would be a close below the triangle (at least four-hour candle close).