

The crypto market is somewhat confused: Bitcoin doesn’t make any significant steps either to the bottom or to the top. What to wait from it then? How to trade BTC in the most profitable way? Let’s take a look at a few Bitcoin price predictions from TradingView users and find out what might happen to the famous cryptocurrency in the nearest days.
On The Way ToHard $9.500 Resistance Level
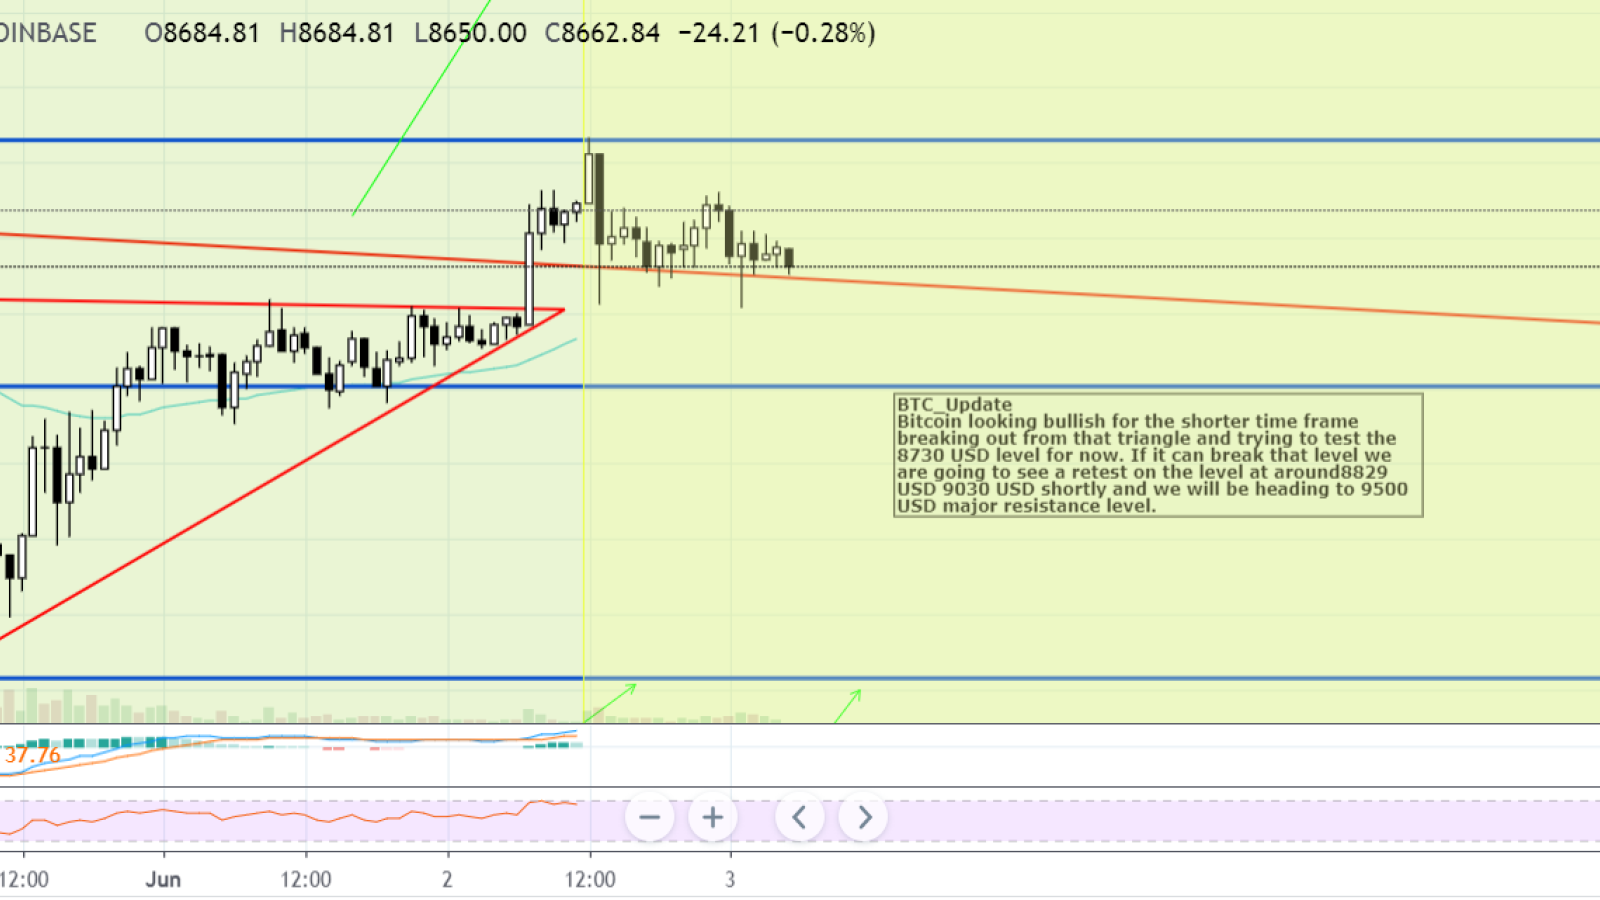
Bitcoin looking bullish for the shorter time frame breaking out from that triangle and trying to test the $8,730 level for now. If it can break that level we are going to see a retest on the level at around $8,829 - $9,030 shortly and we will be heading to $9,500 major resistance level. Yet, judging by the recent charts, there’s a possibility of an ABC correctional trend, which means BTC won’t have a chance to grow in the nearest perspective.
$9,400 is June’s highest point
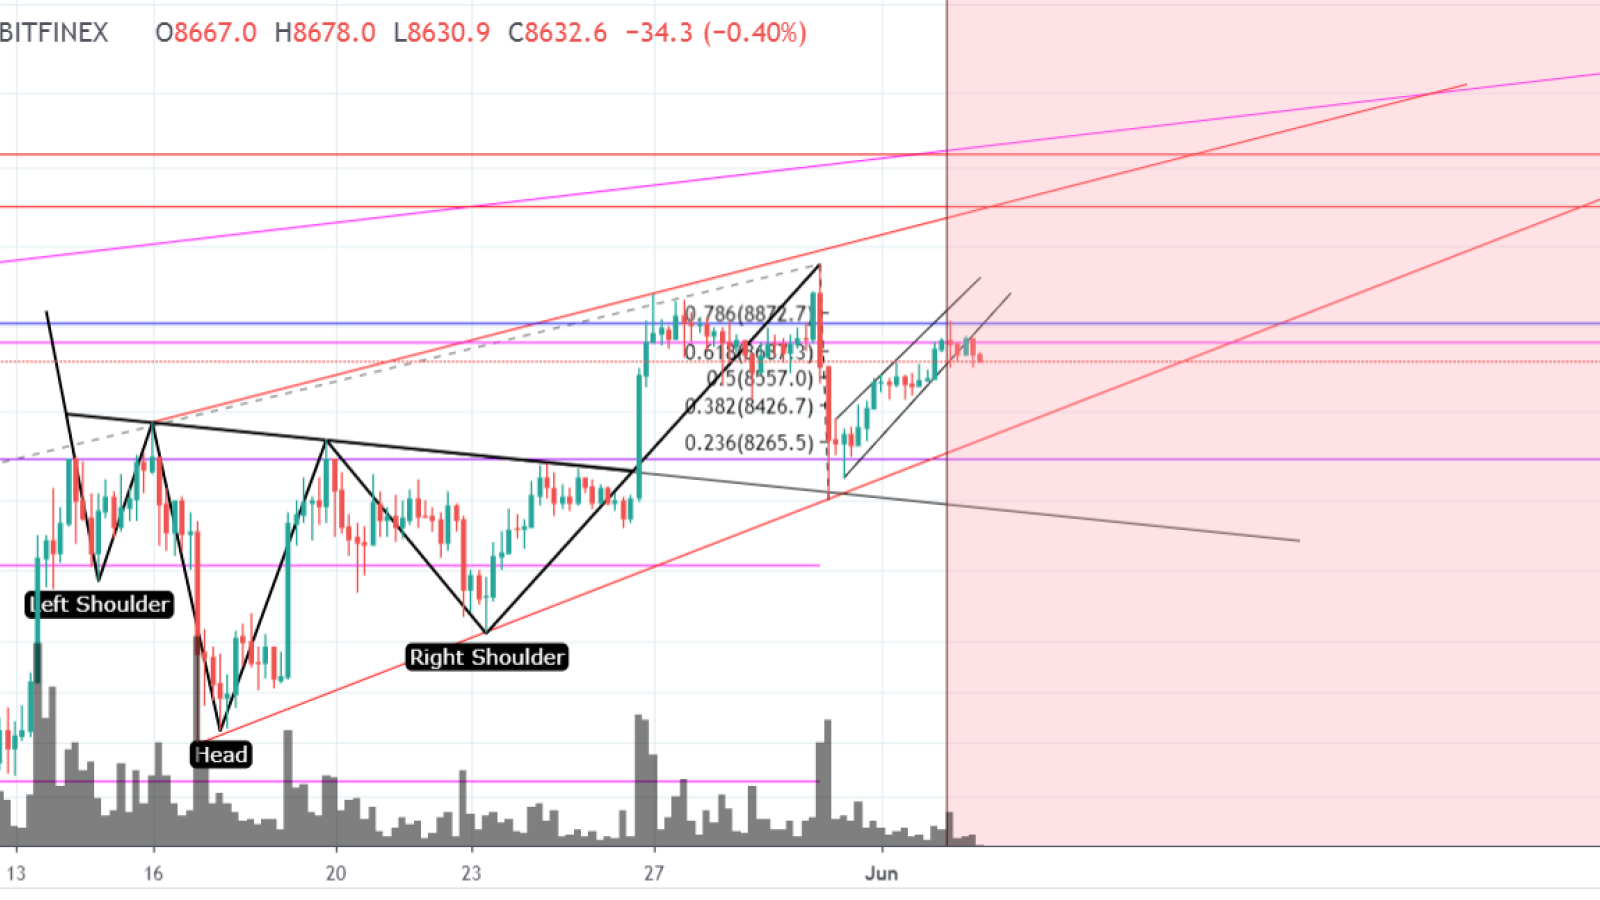
Reverse Head and shoulder neck line retest is very successful, and we getting closer to BTC Major Resist line around $9,400.
After that, we have to see more of the candle, but if we cannot break through it and draw a picture of the adjustment, a very big decline will begin. First of all, the BTC should try to reach $9,400! There is a chance that it can happen in June 2019.
All eyes on Satoshi signal
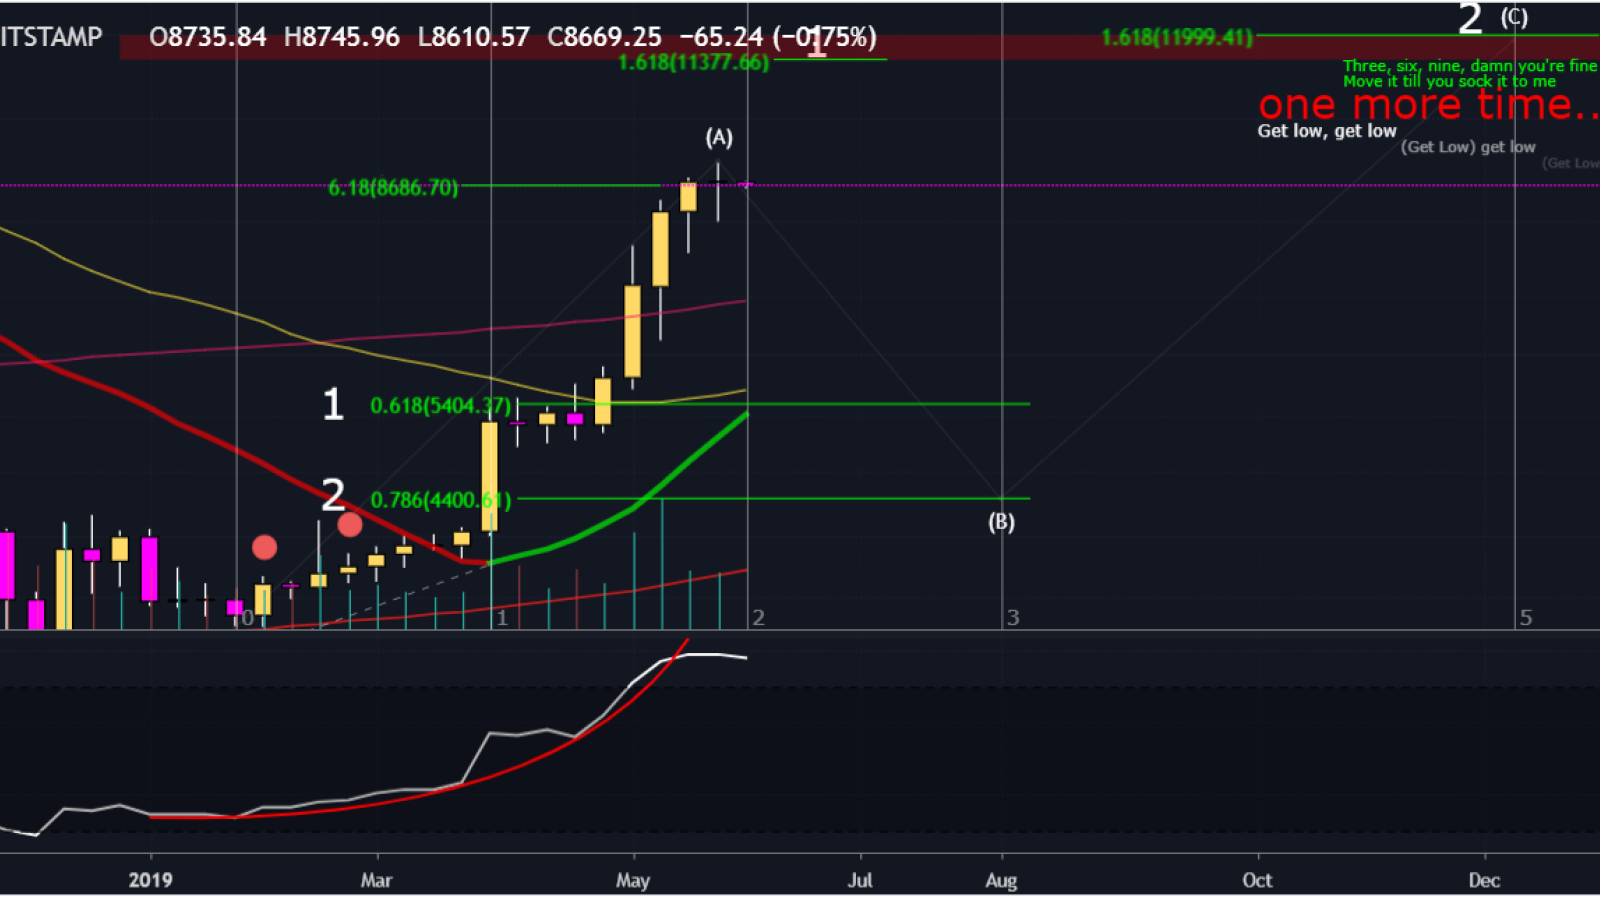
The Satoshi Signal, as the trader calls it, is the most powerful trend reversal signal. Look at the chart. We're sitting high. A long legged Doji at a very high price is not a good sign. We could go slightly higher, but it’s not likely. Traders should edge into a 1-5x short at a local high.
$6K will be the last lowest low
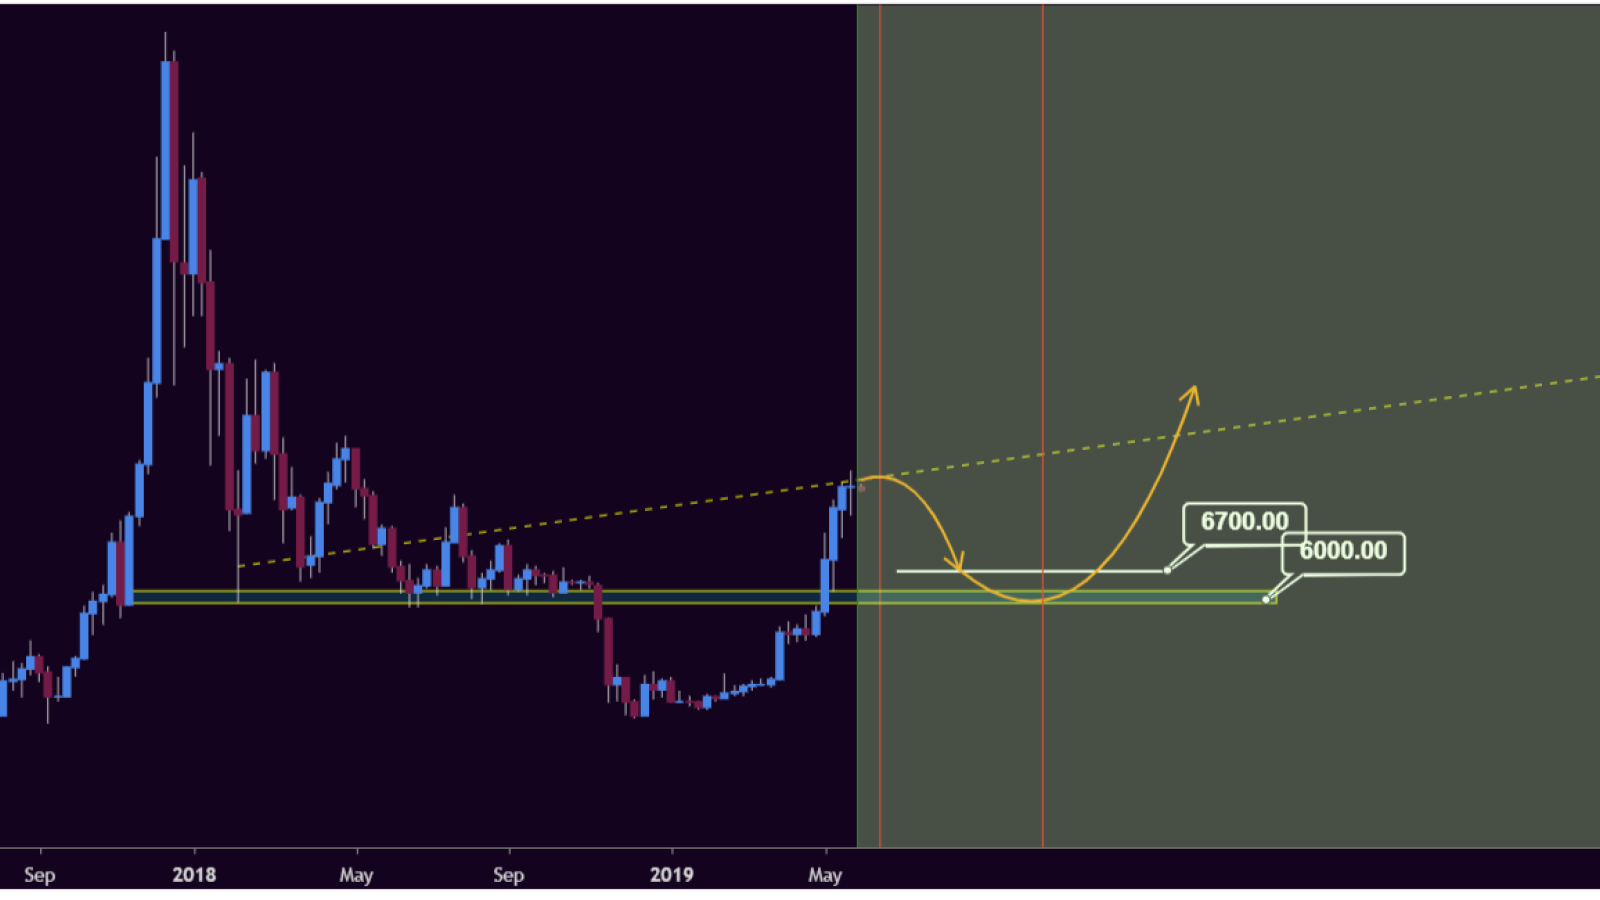
The user claims that Bitcoin needs a deep correction before the real bull run. 17th of June is an important time zone in the weekly chart (16th of Jule are also important inthe daily chart), overlapping with diagonal resistance and touching the median line of an old pitchfork are our signs of a sharp dump.
If the price reaches to $6,000 zone, it will be the last time that BTC touches it and probably Bitcoin will never meet the price again. 21 October is an important time zone in a weekly chart that we expect powerful reactions.
Though the price can stop the downtrend in $6,700, to $6,000 zone is more expected. The stop loss of this analysis is $9,600 that it's too far and untouchable. It’s not likely that the price can reach there.
Final thoughts
What bring in pessimistic mood is the current technical indicators: MACD is ready bearish, RSI is about to test and most likely fail soon. 4 hr is looking weak daily is looking to drop more with a red close by end of the day weekly just crossed downward. Stochs are crossing down on higher time frames. Along with filling out this rising wedge, Bitcoin is preparing for a fall.
Will it reach $9K or even $9.5K level? Day by day, chances for that diminish even though it keeps above the $8K level. Trade carefully!
Bitcoin price charts by TradingView