- Warning: Undefined array key 1 in Drupal\cryptocompare\TwigExtension\RemoveSpace::getcard() (line 3178 of modules/custom/cryptocompare/src/TwigExtension/RemoveSpace.php).
Drupal\cryptocompare\TwigExtension\RemoveSpace::getcard('
Contents
<ul class="article__contents-list"><li class="article__contents-item"><a class="article__contents-link link-pseudo" href="#h239">A drop would be natural</a></li><li class="article__contents-item"><a class="article__contents-link link-pseudo" href="#h331">Bullish flag setup</a></li><li class="article__contents-item"><a class="article__contents-link link-pseudo" href="#h415">Wait for lower low in October</a></li></ul>
Advertisement
Holding around $8,400-8,700 level, Bitcoin continues moving sideways giving alts the way to go. But one day, <a href="https://u.today/bitcoin-price-could-soon-experience-another-push-expert-says">it should either reach $10K</a> or reach the bottom, or both.
How long it should take for bearish market to start, and what will happen first – jump or dump? Let’s observe <a href="https://u.today/time-traveling-bitcoin-prophet-strangely-accurate-predicts-1-million-btc-in-2021">Bitcoin price forecasts</a> from TradingView users.
A drop would be natural
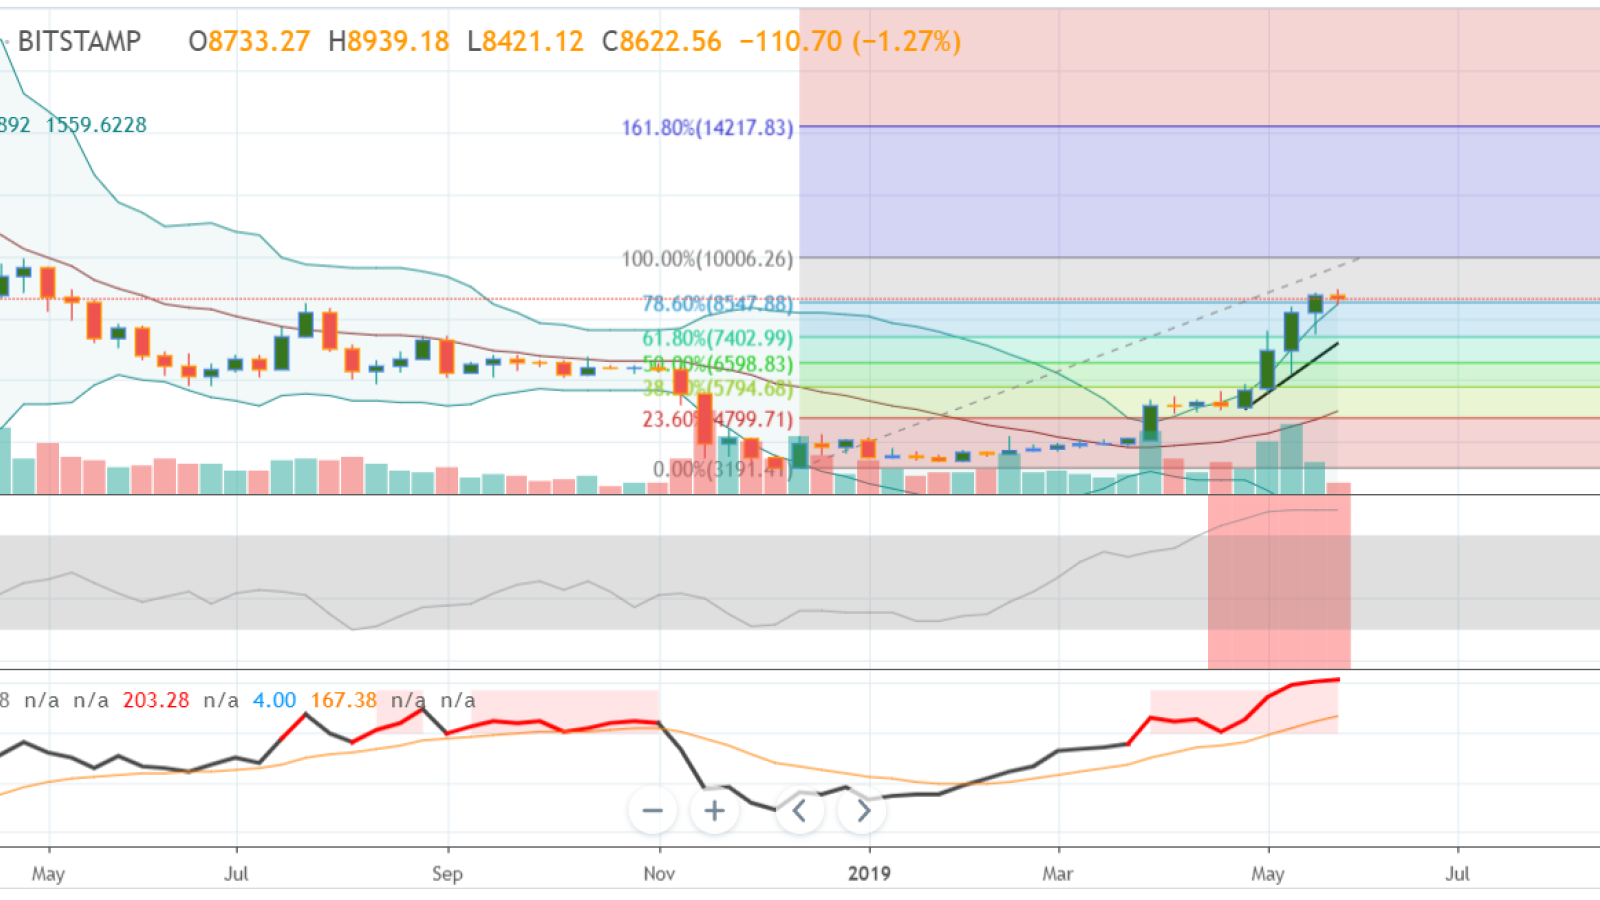
<a rel="dofollow" href="https://www.tradingview.com/chart/BTCUSD/GNdRfM41-The-2-Evils-of-Bitcoin-at-play-here-70-85-drop-realistic/">Bitcoin (BTC) price chart from GlobalTrader_</a>
GlobalTrader_ comes up with the analysis using the bollinger bands to find the Bitcoin Bottom. Right now this may seem very unpopular but we still have an almighty chance of touching $1,500 - $2,500. By the time the BBand low will be placed $1500 - $2500 is not so crazy. This can take 4-6 months to play out.
The user added the NVT and MFI, where they seat today isn't pretty for the short/midterm of BTC.
They are both extremely overbought. History shows us a major correction is on the way 70-85% drawn down. Currently we still have room to grow in price to $10,000.
BTC needs to break is the 20 weekly MA which is currently $5,014 and between 23.6 / 38.2 Fibonacci levels.
This is about 50% drop from $10,000 level but by the time we have a candle close to the 20WMA we will expect the price to be much higher (40%). This is key level of support when $1,500 - $2,500 becomes even more realistic.
<a rel="nofollow" target="_blank" href="#">card</a>
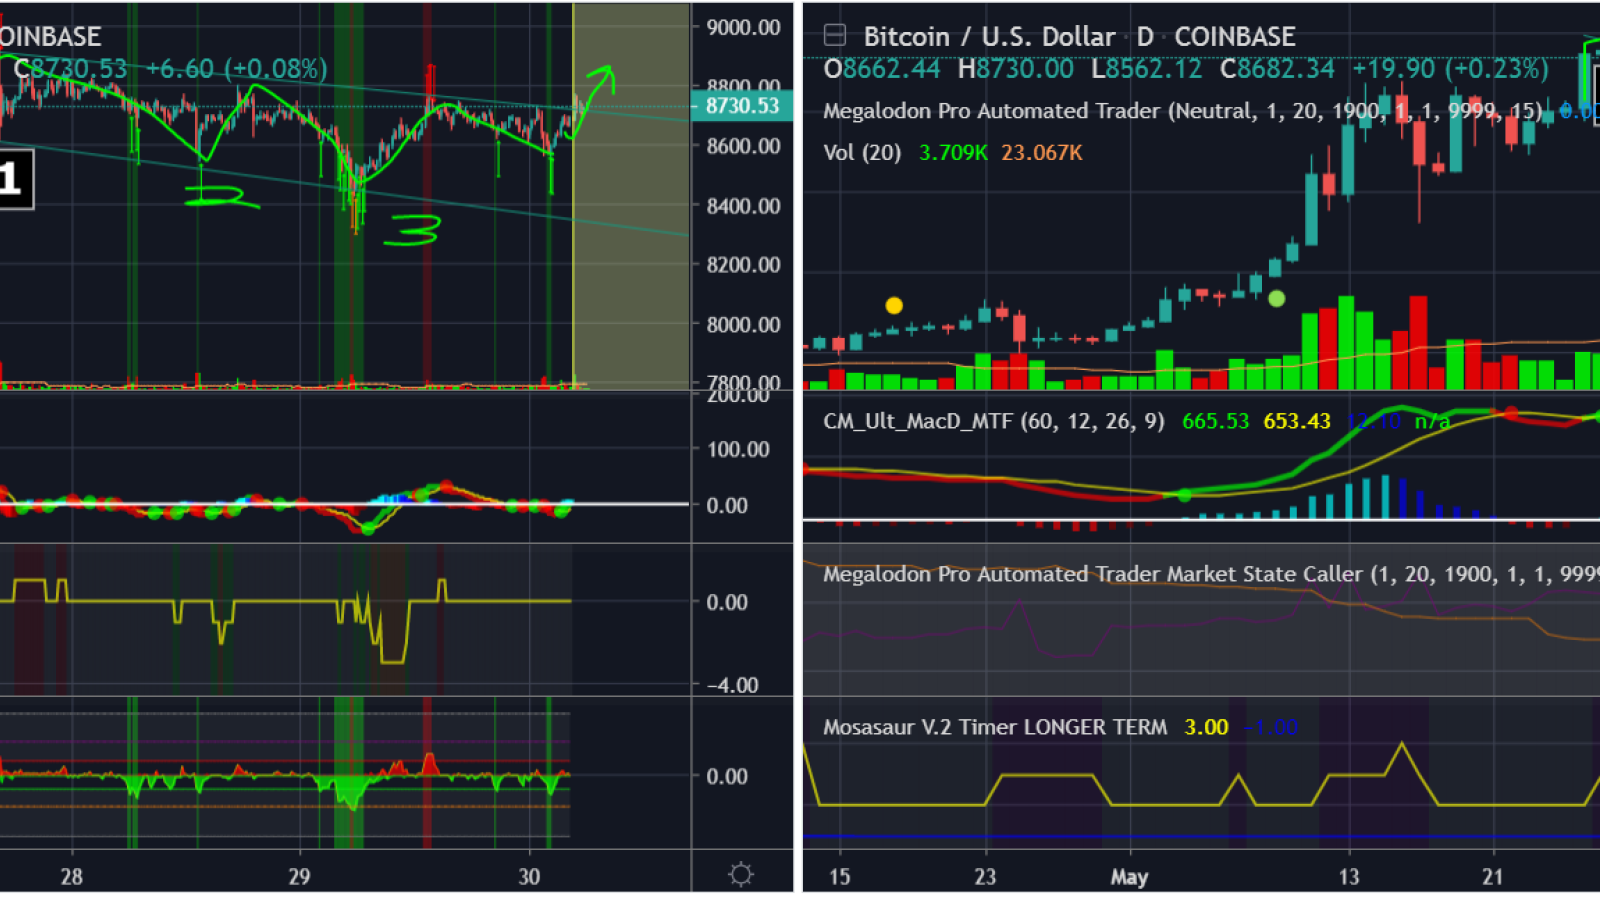
Bullish flag setup
<a rel="dofollow" href="https://www.tradingview.com/chart/BTCUSD/zCooQb8v-Bullish-Flag-Setup-on-Bitcoin/">Bitcoin (BTC) price chart from RandallGurule</a>
The 15 minute chart on Bitcoin from RandallGurule is printing us a bullish flag pattern. All we need now is for the price to break through the top trendline, and then we can expect a big move.
Perhaps, somewhere between $9,400 and $9,500. We should keep tabs on the technical parameters.
<a rel="nofollow" target="_blank" href="#">card</a>
Wait for lower low in October
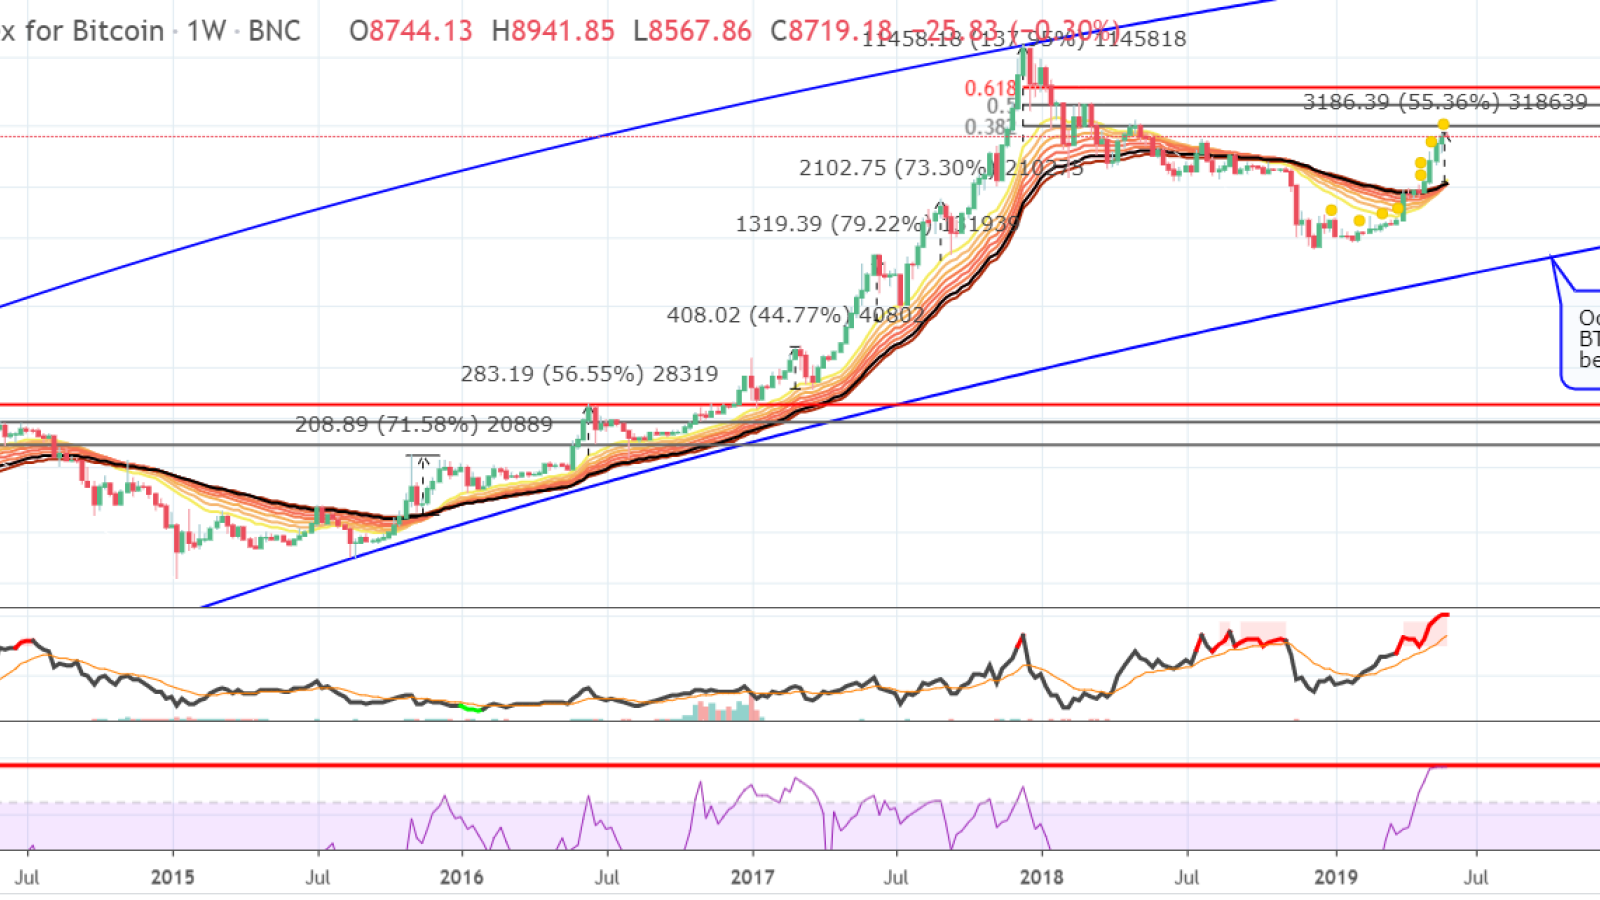
<a rel="dofollow" href="https://www.tradingview.com/chart/BLX/pcEbeujX-This-is-Why-I-ve-Been-Long-in-Bitcoin-But-Not-Bullish/">Bitcoin (BTC) price chart from MagicPoopCannon</a>
Here’s a detailed analysis from one of the most popular traders on TradingView.
First, pay your attention to the indicator at the very bottom of the chart. That's the Money Flow Index. For about the past two weeks, it has been pegged on a reading of 97.
There were only three other occasions in the entire history of Bitcoin where the MFI had a value this high. Each one of those times, Bitcoin was at a major peak.
On average, each time that happened, Bitcoin suffered a correction of 85.33%. Clearly, the money flow is maxed out (in terms of historical readings) and that's not something to be bullish about.
Secondly, we have the NVT . Each time the NVT has flashed red (like it is now) while coupled with a maxed out MFI reading, there was an average correction of 85.33%. A correction of that magnitude, would take us down to the $1,100-1,200 range.
Ironically, that would fulfill the hyperwave theory, but it would break the bottom of the rising arch (in blue.) With that said, if the market hasn't bottomed yet, whether the low is at 3000, 2000, or lower, the absolute low of the market should occur in October.
If it doesn't, it would be purely the result of institutions, AI, high frequency trading, and other things that have polluted the purity of the Bitcoin market, which is what made it so symmetrical in the first place.
Now let’s talk about percentages. When we look at the percentage gains above the weekly ribbon, we can see that during the last bull market, there were several rallies where price pushed about 45-80% higher than the ribbon.
Each time that happened, price corrected at least 40%, usually in a reversion back to the ribbon. Currently, price is 55% above the ribbon.
So, even if this is the beginning of the next bull market, we are due for a correction of at least 40%, in order to revert back to the ribbon.
When we look back at the last time the market broke out above the ribbon, it was at the beginning of the last bull market. That rally stalled out just before price tested the 38.2% retrace.
Currently, we are just below that same retracement level. So, stalling out somewhere around here would be similar to what was seen in 2015, but that is just a relatively insignificant indication.
In the short term, we could see BTC test the $9,500 level.
There’s still chance that we may be entering the next bull market right now. There are plenty of indicators to suggest that.
<blockquote>
When the market shows that the top is in, I will exit or get stopped out, and then I will remain in cash until I feel that it is a good time to re-enter the market. <strong>– said the trader</strong>
</blockquote>
Bitcoin price charts are taken from <a rel="dofollow" href="https://www.tradingview.com/symbols/BTCUSD/?exchange=COINBASE">TradingView</a>
') (Line: 1145)
Drupal\cryptocompare\TwigExtension\RemoveSpace->formatbody(Array) (Line: 54)
__TwigTemplate_75845256f703f5319a38e035b4af7dd9->doDisplay(Array, Array) (Line: 394)
Twig\Template->displayWithErrorHandling(Array, Array) (Line: 367)
Twig\Template->display(Array) (Line: 379)
Twig\Template->render(Array, Array) (Line: 40)
Twig\TemplateWrapper->render(Array) (Line: 53)
twig_render_template('themes/cryptod/templates/field--body.html.twig', Array) (Line: 372)
Drupal\Core\Theme\ThemeManager->render('field', Array) (Line: 436)
Drupal\Core\Render\Renderer->doRender(Array, ) (Line: 204)
Drupal\Core\Render\Renderer->render(Array) (Line: 474)
Drupal\Core\Template\TwigExtension->escapeFilter(Object, Array, 'html', NULL, 1) (Line: 1002)
__TwigTemplate_625426e732c5f7a66fde6d628d98a6b2->doDisplay(Array, Array) (Line: 394)
Twig\Template->displayWithErrorHandling(Array, Array) (Line: 367)
Twig\Template->display(Array) (Line: 62)
__TwigTemplate_e934e56c1e459c359b150360c7169113->doDisplay(Array, Array) (Line: 394)
Twig\Template->displayWithErrorHandling(Array, Array) (Line: 367)
Twig\Template->display(Array) (Line: 379)
Twig\Template->render(Array, Array) (Line: 40)
Twig\TemplateWrapper->render(Array) (Line: 53)
twig_render_template('themes/cryptod/templates/node.html.twig', Array) (Line: 372)
Drupal\Core\Theme\ThemeManager->render('node', Array) (Line: 436)
Drupal\Core\Render\Renderer->doRender(Array, ) (Line: 204)
Drupal\Core\Render\Renderer->render(Array, ) (Line: 238)
Drupal\Core\Render\MainContent\HtmlRenderer->Drupal\Core\Render\MainContent\{closure}() (Line: 583)
Drupal\Core\Render\Renderer->executeInRenderContext(Object, Object) (Line: 239)
Drupal\Core\Render\MainContent\HtmlRenderer->prepare(Array, Object, Object) (Line: 128)
Drupal\Core\Render\MainContent\HtmlRenderer->renderResponse(Array, Object, Object) (Line: 90)
Drupal\Core\EventSubscriber\MainContentViewSubscriber->onViewRenderArray(Object, 'kernel.view', Object)
call_user_func(Array, Object, 'kernel.view', Object) (Line: 111)
Drupal\Component\EventDispatcher\ContainerAwareEventDispatcher->dispatch(Object, 'kernel.view') (Line: 187)
Symfony\Component\HttpKernel\HttpKernel->handleRaw(Object, 1) (Line: 76)
Symfony\Component\HttpKernel\HttpKernel->handle(Object, 1, 1) (Line: 58)
Drupal\Core\StackMiddleware\Session->handle(Object, 1, 1) (Line: 48)
Drupal\Core\StackMiddleware\KernelPreHandle->handle(Object, 1, 1) (Line: 191)
Drupal\page_cache\StackMiddleware\PageCache->fetch(Object, 1, 1) (Line: 128)
Drupal\page_cache\StackMiddleware\PageCache->lookup(Object, 1, 1) (Line: 82)
Drupal\page_cache\StackMiddleware\PageCache->handle(Object, 1, 1) (Line: 48)
Drupal\Core\StackMiddleware\ReverseProxyMiddleware->handle(Object, 1, 1) (Line: 51)
Drupal\Core\StackMiddleware\NegotiationMiddleware->handle(Object, 1, 1) (Line: 51)
Drupal\Core\StackMiddleware\StackedHttpKernel->handle(Object, 1, 1) (Line: 704)
Drupal\Core\DrupalKernel->handle(Object) (Line: 18)
- Warning: Undefined array key 1 in Drupal\cryptocompare\TwigExtension\RemoveSpace::getcard() (line 3181 of modules/custom/cryptocompare/src/TwigExtension/RemoveSpace.php).
Drupal\cryptocompare\TwigExtension\RemoveSpace::getcard('
                    Contents
                    <ul class="article__contents-list"><li class="article__contents-item"><a class="article__contents-link link-pseudo" href="#h239">A drop would be natural</a></li><li class="article__contents-item"><a class="article__contents-link link-pseudo" href="#h331">Bullish flag setup</a></li><li class="article__contents-item"><a class="article__contents-link link-pseudo" href="#h415">Wait for lower low in October</a></li></ul>
    Advertisement


Holding around $8,400-8,700 level, Bitcoin continues moving sideways giving alts the way to go. But one day, <a href="https://u.today/bitcoin-price-could-soon-experience-another-push-expert-says">it should either reach $10K</a> or reach the bottom, or both.


How long it should take for bearish market to start, and what will happen first – jump or dump? Let’s observe <a href="https://u.today/time-traveling-bitcoin-prophet-strangely-accurate-predicts-1-million-btc-in-2021">Bitcoin price forecasts</a> from TradingView users.

A drop would be natural
<a rel="dofollow" href="https://www.tradingview.com/chart/BTCUSD/GNdRfM41-The-2-Evils-of-Bitcoin-at-play-here-70-85-drop-realistic/">Bitcoin (BTC) price chart from GlobalTrader_</a>
GlobalTrader_ comes up with the analysis using the bollinger bands to find the Bitcoin Bottom. Right now this may seem very unpopular but we still have an almighty chance of touching $1,500 - $2,500. By the time the BBand low will be placed $1500 - $2500 is not so crazy. This can take 4-6 months to play out.

The user added the NVT and MFI, where they seat today isn't pretty for the short/midterm of BTC.

They are both extremely overbought. History shows us a major correction is on the way 70-85% drawn down. Currently we still have room to grow in price to $10,000.

BTC needs to break is the 20 weekly MA which is currently $5,014 and between 23.6 / 38.2 Fibonacci levels.

This is about 50% drop from $10,000 level but by the time we have a candle close to the 20WMA we will expect the price to be much higher (40%). This is key level of support when $1,500 - $2,500 becomes even more realistic.

<a rel="nofollow" target="_blank" href="#">card</a>

Bullish flag setup
<a rel="dofollow" href="https://www.tradingview.com/chart/BTCUSD/zCooQb8v-Bullish-Flag-Setup-on-Bitcoin/">Bitcoin (BTC) price chart from RandallGurule</a>
The 15 minute chart on Bitcoin from RandallGurule is printing us a bullish flag pattern. All we need now is for the price to break through the top trendline, and then we can expect a big move.

Perhaps, somewhere between $9,400 and $9,500. We should keep tabs on the technical parameters.

<a rel="nofollow" target="_blank" href="#">card</a>

Wait for lower low in October
<a rel="dofollow" href="https://www.tradingview.com/chart/BLX/pcEbeujX-This-is-Why-I-ve-Been-Long-in-Bitcoin-But-Not-Bullish/">Bitcoin (BTC) price chart from MagicPoopCannon</a>
Here’s a detailed analysis from one of the most popular traders on TradingView.

First, pay your attention to the indicator at the very bottom of the chart. That's the Money Flow Index. For about the past two weeks, it has been pegged on a reading of 97.

There were only three other occasions in the entire history of Bitcoin where the MFI had a value this high. Each one of those times, Bitcoin was at a major peak.

On average, each time that happened, Bitcoin suffered a correction of 85.33%. Clearly, the money flow is maxed out (in terms of historical readings) and that's not something to be bullish about.

Secondly, we have the NVT . Each time the NVT has flashed red (like it is now) while coupled with a maxed out MFI reading, there was an average correction of 85.33%. A correction of that magnitude, would take us down to the $1,100-1,200 range.

Ironically, that would fulfill the hyperwave theory, but it would break the bottom of the rising arch (in blue.) With that said, if the market hasn't bottomed yet, whether the low is at 3000, 2000, or lower, the absolute low of the market should occur in October.

If it doesn't, it would be purely the result of institutions, AI, high frequency trading, and other things that have polluted the purity of the Bitcoin market, which is what made it so symmetrical in the first place.

Now let’s talk about percentages. When we look at the percentage gains above the weekly ribbon, we can see that during the last bull market, there were several rallies where price pushed about 45-80% higher than the ribbon.

Each time that happened, price corrected at least 40%, usually in a reversion back to the ribbon. Currently, price is 55% above the ribbon.

So, even if this is the beginning of the next bull market, we are due for a correction of at least 40%, in order to revert back to the ribbon.

When we look back at the last time the market broke out above the ribbon, it was at the beginning of the last bull market. That rally stalled out just before price tested the 38.2% retrace.

Currently, we are just below that same retracement level. So, stalling out somewhere around here would be similar to what was seen in 2015, but that is just a relatively insignificant indication.

In the short term, we could see BTC test the $9,500 level.

There’s still chance that we may be entering the next bull market right now. There are plenty of indicators to suggest that.

<blockquote>
When the market shows that the top is in, I will exit or get stopped out, and then I will remain in cash until I feel that it is a good time to re-enter the market. <strong>– said the trader</strong>
</blockquote>

Bitcoin price charts are taken from <a rel="dofollow" href="https://www.tradingview.com/symbols/BTCUSD/?exchange=COINBASE">TradingView</a>
') (Line: 1145)
Drupal\cryptocompare\TwigExtension\RemoveSpace->formatbody(Array) (Line: 54)
__TwigTemplate_75845256f703f5319a38e035b4af7dd9->doDisplay(Array, Array) (Line: 394)
Twig\Template->displayWithErrorHandling(Array, Array) (Line: 367)
Twig\Template->display(Array) (Line: 379)
Twig\Template->render(Array, Array) (Line: 40)
Twig\TemplateWrapper->render(Array) (Line: 53)
twig_render_template('themes/cryptod/templates/field--body.html.twig', Array) (Line: 372)
Drupal\Core\Theme\ThemeManager->render('field', Array) (Line: 436)
Drupal\Core\Render\Renderer->doRender(Array, ) (Line: 204)
Drupal\Core\Render\Renderer->render(Array) (Line: 474)
Drupal\Core\Template\TwigExtension->escapeFilter(Object, Array, 'html', NULL, 1) (Line: 1002)
__TwigTemplate_625426e732c5f7a66fde6d628d98a6b2->doDisplay(Array, Array) (Line: 394)
Twig\Template->displayWithErrorHandling(Array, Array) (Line: 367)
Twig\Template->display(Array) (Line: 62)
__TwigTemplate_e934e56c1e459c359b150360c7169113->doDisplay(Array, Array) (Line: 394)
Twig\Template->displayWithErrorHandling(Array, Array) (Line: 367)
Twig\Template->display(Array) (Line: 379)
Twig\Template->render(Array, Array) (Line: 40)
Twig\TemplateWrapper->render(Array) (Line: 53)
twig_render_template('themes/cryptod/templates/node.html.twig', Array) (Line: 372)
Drupal\Core\Theme\ThemeManager->render('node', Array) (Line: 436)
Drupal\Core\Render\Renderer->doRender(Array, ) (Line: 204)
Drupal\Core\Render\Renderer->render(Array, ) (Line: 238)
Drupal\Core\Render\MainContent\HtmlRenderer->Drupal\Core\Render\MainContent\{closure}() (Line: 583)
Drupal\Core\Render\Renderer->executeInRenderContext(Object, Object) (Line: 239)
Drupal\Core\Render\MainContent\HtmlRenderer->prepare(Array, Object, Object) (Line: 128)
Drupal\Core\Render\MainContent\HtmlRenderer->renderResponse(Array, Object, Object) (Line: 90)
Drupal\Core\EventSubscriber\MainContentViewSubscriber->onViewRenderArray(Object, 'kernel.view', Object)
call_user_func(Array, Object, 'kernel.view', Object) (Line: 111)
Drupal\Component\EventDispatcher\ContainerAwareEventDispatcher->dispatch(Object, 'kernel.view') (Line: 187)
Symfony\Component\HttpKernel\HttpKernel->handleRaw(Object, 1) (Line: 76)
Symfony\Component\HttpKernel\HttpKernel->handle(Object, 1, 1) (Line: 58)
Drupal\Core\StackMiddleware\Session->handle(Object, 1, 1) (Line: 48)
Drupal\Core\StackMiddleware\KernelPreHandle->handle(Object, 1, 1) (Line: 191)
Drupal\page_cache\StackMiddleware\PageCache->fetch(Object, 1, 1) (Line: 128)
Drupal\page_cache\StackMiddleware\PageCache->lookup(Object, 1, 1) (Line: 82)
Drupal\page_cache\StackMiddleware\PageCache->handle(Object, 1, 1) (Line: 48)
Drupal\Core\StackMiddleware\ReverseProxyMiddleware->handle(Object, 1, 1) (Line: 51)
Drupal\Core\StackMiddleware\NegotiationMiddleware->handle(Object, 1, 1) (Line: 51)
Drupal\Core\StackMiddleware\StackedHttpKernel->handle(Object, 1, 1) (Line: 704)
Drupal\Core\DrupalKernel->handle(Object) (Line: 18)
- Warning: Undefined array key 1 in Drupal\cryptocompare\TwigExtension\RemoveSpace::getcard() (line 3178 of modules/custom/cryptocompare/src/TwigExtension/RemoveSpace.php).
Drupal\cryptocompare\TwigExtension\RemoveSpace::getcard('
                    Contents
                    <ul class="article__contents-list"><li class="article__contents-item"><a class="article__contents-link link-pseudo" href="#h239">A drop would be natural</a></li><li class="article__contents-item"><a class="article__contents-link link-pseudo" href="#h331">Bullish flag setup</a></li><li class="article__contents-item"><a class="article__contents-link link-pseudo" href="#h415">Wait for lower low in October</a></li></ul>
    Advertisement


Holding around $8,400-8,700 level, Bitcoin continues moving sideways giving alts the way to go. But one day, <a href="https://u.today/bitcoin-price-could-soon-experience-another-push-expert-says">it should either reach $10K</a> or reach the bottom, or both.


How long it should take for bearish market to start, and what will happen first – jump or dump? Let’s observe <a href="https://u.today/time-traveling-bitcoin-prophet-strangely-accurate-predicts-1-million-btc-in-2021">Bitcoin price forecasts</a> from TradingView users.

A drop would be natural
<a rel="dofollow" href="https://www.tradingview.com/chart/BTCUSD/GNdRfM41-The-2-Evils-of-Bitcoin-at-play-here-70-85-drop-realistic/">Bitcoin (BTC) price chart from GlobalTrader_</a>
GlobalTrader_ comes up with the analysis using the bollinger bands to find the Bitcoin Bottom. Right now this may seem very unpopular but we still have an almighty chance of touching $1,500 - $2,500. By the time the BBand low will be placed $1500 - $2500 is not so crazy. This can take 4-6 months to play out.

The user added the NVT and MFI, where they seat today isn't pretty for the short/midterm of BTC.

They are both extremely overbought. History shows us a major correction is on the way 70-85% drawn down. Currently we still have room to grow in price to $10,000.

BTC needs to break is the 20 weekly MA which is currently $5,014 and between 23.6 / 38.2 Fibonacci levels.

This is about 50% drop from $10,000 level but by the time we have a candle close to the 20WMA we will expect the price to be much higher (40%). This is key level of support when $1,500 - $2,500 becomes even more realistic.

<a rel="nofollow" target="_blank" href="#">card</a>

Bullish flag setup
<a rel="dofollow" href="https://www.tradingview.com/chart/BTCUSD/zCooQb8v-Bullish-Flag-Setup-on-Bitcoin/">Bitcoin (BTC) price chart from RandallGurule</a>
The 15 minute chart on Bitcoin from RandallGurule is printing us a bullish flag pattern. All we need now is for the price to break through the top trendline, and then we can expect a big move.

Perhaps, somewhere between $9,400 and $9,500. We should keep tabs on the technical parameters.

<a rel="nofollow" target="_blank" href="#">card</a>

Wait for lower low in October
<a rel="dofollow" href="https://www.tradingview.com/chart/BLX/pcEbeujX-This-is-Why-I-ve-Been-Long-in-Bitcoin-But-Not-Bullish/">Bitcoin (BTC) price chart from MagicPoopCannon</a>
Here’s a detailed analysis from one of the most popular traders on TradingView.

First, pay your attention to the indicator at the very bottom of the chart. That's the Money Flow Index. For about the past two weeks, it has been pegged on a reading of 97.

There were only three other occasions in the entire history of Bitcoin where the MFI had a value this high. Each one of those times, Bitcoin was at a major peak.

On average, each time that happened, Bitcoin suffered a correction of 85.33%. Clearly, the money flow is maxed out (in terms of historical readings) and that's not something to be bullish about.

Secondly, we have the NVT . Each time the NVT has flashed red (like it is now) while coupled with a maxed out MFI reading, there was an average correction of 85.33%. A correction of that magnitude, would take us down to the $1,100-1,200 range.

Ironically, that would fulfill the hyperwave theory, but it would break the bottom of the rising arch (in blue.) With that said, if the market hasn't bottomed yet, whether the low is at 3000, 2000, or lower, the absolute low of the market should occur in October.

If it doesn't, it would be purely the result of institutions, AI, high frequency trading, and other things that have polluted the purity of the Bitcoin market, which is what made it so symmetrical in the first place.

Now let’s talk about percentages. When we look at the percentage gains above the weekly ribbon, we can see that during the last bull market, there were several rallies where price pushed about 45-80% higher than the ribbon.

Each time that happened, price corrected at least 40%, usually in a reversion back to the ribbon. Currently, price is 55% above the ribbon.

So, even if this is the beginning of the next bull market, we are due for a correction of at least 40%, in order to revert back to the ribbon.

When we look back at the last time the market broke out above the ribbon, it was at the beginning of the last bull market. That rally stalled out just before price tested the 38.2% retrace.

Currently, we are just below that same retracement level. So, stalling out somewhere around here would be similar to what was seen in 2015, but that is just a relatively insignificant indication.

In the short term, we could see BTC test the $9,500 level.

There’s still chance that we may be entering the next bull market right now. There are plenty of indicators to suggest that.

<blockquote>
When the market shows that the top is in, I will exit or get stopped out, and then I will remain in cash until I feel that it is a good time to re-enter the market. <strong>– said the trader</strong>
</blockquote>

Bitcoin price charts are taken from <a rel="dofollow" href="https://www.tradingview.com/symbols/BTCUSD/?exchange=COINBASE">TradingView</a>
') (Line: 1145)
Drupal\cryptocompare\TwigExtension\RemoveSpace->formatbody(Array) (Line: 54)
__TwigTemplate_75845256f703f5319a38e035b4af7dd9->doDisplay(Array, Array) (Line: 394)
Twig\Template->displayWithErrorHandling(Array, Array) (Line: 367)
Twig\Template->display(Array) (Line: 379)
Twig\Template->render(Array, Array) (Line: 40)
Twig\TemplateWrapper->render(Array) (Line: 53)
twig_render_template('themes/cryptod/templates/field--body.html.twig', Array) (Line: 372)
Drupal\Core\Theme\ThemeManager->render('field', Array) (Line: 436)
Drupal\Core\Render\Renderer->doRender(Array, ) (Line: 204)
Drupal\Core\Render\Renderer->render(Array) (Line: 474)
Drupal\Core\Template\TwigExtension->escapeFilter(Object, Array, 'html', NULL, 1) (Line: 1002)
__TwigTemplate_625426e732c5f7a66fde6d628d98a6b2->doDisplay(Array, Array) (Line: 394)
Twig\Template->displayWithErrorHandling(Array, Array) (Line: 367)
Twig\Template->display(Array) (Line: 62)
__TwigTemplate_e934e56c1e459c359b150360c7169113->doDisplay(Array, Array) (Line: 394)
Twig\Template->displayWithErrorHandling(Array, Array) (Line: 367)
Twig\Template->display(Array) (Line: 379)
Twig\Template->render(Array, Array) (Line: 40)
Twig\TemplateWrapper->render(Array) (Line: 53)
twig_render_template('themes/cryptod/templates/node.html.twig', Array) (Line: 372)
Drupal\Core\Theme\ThemeManager->render('node', Array) (Line: 436)
Drupal\Core\Render\Renderer->doRender(Array, ) (Line: 204)
Drupal\Core\Render\Renderer->render(Array, ) (Line: 238)
Drupal\Core\Render\MainContent\HtmlRenderer->Drupal\Core\Render\MainContent\{closure}() (Line: 583)
Drupal\Core\Render\Renderer->executeInRenderContext(Object, Object) (Line: 239)
Drupal\Core\Render\MainContent\HtmlRenderer->prepare(Array, Object, Object) (Line: 128)
Drupal\Core\Render\MainContent\HtmlRenderer->renderResponse(Array, Object, Object) (Line: 90)
Drupal\Core\EventSubscriber\MainContentViewSubscriber->onViewRenderArray(Object, 'kernel.view', Object)
call_user_func(Array, Object, 'kernel.view', Object) (Line: 111)
Drupal\Component\EventDispatcher\ContainerAwareEventDispatcher->dispatch(Object, 'kernel.view') (Line: 187)
Symfony\Component\HttpKernel\HttpKernel->handleRaw(Object, 1) (Line: 76)
Symfony\Component\HttpKernel\HttpKernel->handle(Object, 1, 1) (Line: 58)
Drupal\Core\StackMiddleware\Session->handle(Object, 1, 1) (Line: 48)
Drupal\Core\StackMiddleware\KernelPreHandle->handle(Object, 1, 1) (Line: 191)
Drupal\page_cache\StackMiddleware\PageCache->fetch(Object, 1, 1) (Line: 128)
Drupal\page_cache\StackMiddleware\PageCache->lookup(Object, 1, 1) (Line: 82)
Drupal\page_cache\StackMiddleware\PageCache->handle(Object, 1, 1) (Line: 48)
Drupal\Core\StackMiddleware\ReverseProxyMiddleware->handle(Object, 1, 1) (Line: 51)
Drupal\Core\StackMiddleware\NegotiationMiddleware->handle(Object, 1, 1) (Line: 51)
Drupal\Core\StackMiddleware\StackedHttpKernel->handle(Object, 1, 1) (Line: 704)
Drupal\Core\DrupalKernel->handle(Object) (Line: 18)
- Warning: Undefined array key 1 in Drupal\cryptocompare\TwigExtension\RemoveSpace::getcard() (line 3181 of modules/custom/cryptocompare/src/TwigExtension/RemoveSpace.php).
Drupal\cryptocompare\TwigExtension\RemoveSpace::getcard('
                    Contents
                    <ul class="article__contents-list"><li class="article__contents-item"><a class="article__contents-link link-pseudo" href="#h239">A drop would be natural</a></li><li class="article__contents-item"><a class="article__contents-link link-pseudo" href="#h331">Bullish flag setup</a></li><li class="article__contents-item"><a class="article__contents-link link-pseudo" href="#h415">Wait for lower low in October</a></li></ul>
    Advertisement


Holding around $8,400-8,700 level, Bitcoin continues moving sideways giving alts the way to go. But one day, <a href="https://u.today/bitcoin-price-could-soon-experience-another-push-expert-says">it should either reach $10K</a> or reach the bottom, or both.


How long it should take for bearish market to start, and what will happen first – jump or dump? Let’s observe <a href="https://u.today/time-traveling-bitcoin-prophet-strangely-accurate-predicts-1-million-btc-in-2021">Bitcoin price forecasts</a> from TradingView users.

A drop would be natural
<a rel="dofollow" href="https://www.tradingview.com/chart/BTCUSD/GNdRfM41-The-2-Evils-of-Bitcoin-at-play-here-70-85-drop-realistic/">Bitcoin (BTC) price chart from GlobalTrader_</a>
GlobalTrader_ comes up with the analysis using the bollinger bands to find the Bitcoin Bottom. Right now this may seem very unpopular but we still have an almighty chance of touching $1,500 - $2,500. By the time the BBand low will be placed $1500 - $2500 is not so crazy. This can take 4-6 months to play out.

The user added the NVT and MFI, where they seat today isn't pretty for the short/midterm of BTC.

They are both extremely overbought. History shows us a major correction is on the way 70-85% drawn down. Currently we still have room to grow in price to $10,000.

BTC needs to break is the 20 weekly MA which is currently $5,014 and between 23.6 / 38.2 Fibonacci levels.

This is about 50% drop from $10,000 level but by the time we have a candle close to the 20WMA we will expect the price to be much higher (40%). This is key level of support when $1,500 - $2,500 becomes even more realistic.

<a rel="nofollow" target="_blank" href="#">card</a>

Bullish flag setup
<a rel="dofollow" href="https://www.tradingview.com/chart/BTCUSD/zCooQb8v-Bullish-Flag-Setup-on-Bitcoin/">Bitcoin (BTC) price chart from RandallGurule</a>
The 15 minute chart on Bitcoin from RandallGurule is printing us a bullish flag pattern. All we need now is for the price to break through the top trendline, and then we can expect a big move.

Perhaps, somewhere between $9,400 and $9,500. We should keep tabs on the technical parameters.

<a rel="nofollow" target="_blank" href="#">card</a>

Wait for lower low in October
<a rel="dofollow" href="https://www.tradingview.com/chart/BLX/pcEbeujX-This-is-Why-I-ve-Been-Long-in-Bitcoin-But-Not-Bullish/">Bitcoin (BTC) price chart from MagicPoopCannon</a>
Here’s a detailed analysis from one of the most popular traders on TradingView.

First, pay your attention to the indicator at the very bottom of the chart. That's the Money Flow Index. For about the past two weeks, it has been pegged on a reading of 97.

There were only three other occasions in the entire history of Bitcoin where the MFI had a value this high. Each one of those times, Bitcoin was at a major peak.

On average, each time that happened, Bitcoin suffered a correction of 85.33%. Clearly, the money flow is maxed out (in terms of historical readings) and that's not something to be bullish about.

Secondly, we have the NVT . Each time the NVT has flashed red (like it is now) while coupled with a maxed out MFI reading, there was an average correction of 85.33%. A correction of that magnitude, would take us down to the $1,100-1,200 range.

Ironically, that would fulfill the hyperwave theory, but it would break the bottom of the rising arch (in blue.) With that said, if the market hasn't bottomed yet, whether the low is at 3000, 2000, or lower, the absolute low of the market should occur in October.

If it doesn't, it would be purely the result of institutions, AI, high frequency trading, and other things that have polluted the purity of the Bitcoin market, which is what made it so symmetrical in the first place.

Now let’s talk about percentages. When we look at the percentage gains above the weekly ribbon, we can see that during the last bull market, there were several rallies where price pushed about 45-80% higher than the ribbon.

Each time that happened, price corrected at least 40%, usually in a reversion back to the ribbon. Currently, price is 55% above the ribbon.

So, even if this is the beginning of the next bull market, we are due for a correction of at least 40%, in order to revert back to the ribbon.

When we look back at the last time the market broke out above the ribbon, it was at the beginning of the last bull market. That rally stalled out just before price tested the 38.2% retrace.

Currently, we are just below that same retracement level. So, stalling out somewhere around here would be similar to what was seen in 2015, but that is just a relatively insignificant indication.

In the short term, we could see BTC test the $9,500 level.

There’s still chance that we may be entering the next bull market right now. There are plenty of indicators to suggest that.

<blockquote>
When the market shows that the top is in, I will exit or get stopped out, and then I will remain in cash until I feel that it is a good time to re-enter the market. <strong>– said the trader</strong>
</blockquote>

Bitcoin price charts are taken from <a rel="dofollow" href="https://www.tradingview.com/symbols/BTCUSD/?exchange=COINBASE">TradingView</a>
') (Line: 1145)
Drupal\cryptocompare\TwigExtension\RemoveSpace->formatbody(Array) (Line: 54)
__TwigTemplate_75845256f703f5319a38e035b4af7dd9->doDisplay(Array, Array) (Line: 394)
Twig\Template->displayWithErrorHandling(Array, Array) (Line: 367)
Twig\Template->display(Array) (Line: 379)
Twig\Template->render(Array, Array) (Line: 40)
Twig\TemplateWrapper->render(Array) (Line: 53)
twig_render_template('themes/cryptod/templates/field--body.html.twig', Array) (Line: 372)
Drupal\Core\Theme\ThemeManager->render('field', Array) (Line: 436)
Drupal\Core\Render\Renderer->doRender(Array, ) (Line: 204)
Drupal\Core\Render\Renderer->render(Array) (Line: 474)
Drupal\Core\Template\TwigExtension->escapeFilter(Object, Array, 'html', NULL, 1) (Line: 1002)
__TwigTemplate_625426e732c5f7a66fde6d628d98a6b2->doDisplay(Array, Array) (Line: 394)
Twig\Template->displayWithErrorHandling(Array, Array) (Line: 367)
Twig\Template->display(Array) (Line: 62)
__TwigTemplate_e934e56c1e459c359b150360c7169113->doDisplay(Array, Array) (Line: 394)
Twig\Template->displayWithErrorHandling(Array, Array) (Line: 367)
Twig\Template->display(Array) (Line: 379)
Twig\Template->render(Array, Array) (Line: 40)
Twig\TemplateWrapper->render(Array) (Line: 53)
twig_render_template('themes/cryptod/templates/node.html.twig', Array) (Line: 372)
Drupal\Core\Theme\ThemeManager->render('node', Array) (Line: 436)
Drupal\Core\Render\Renderer->doRender(Array, ) (Line: 204)
Drupal\Core\Render\Renderer->render(Array, ) (Line: 238)
Drupal\Core\Render\MainContent\HtmlRenderer->Drupal\Core\Render\MainContent\{closure}() (Line: 583)
Drupal\Core\Render\Renderer->executeInRenderContext(Object, Object) (Line: 239)
Drupal\Core\Render\MainContent\HtmlRenderer->prepare(Array, Object, Object) (Line: 128)
Drupal\Core\Render\MainContent\HtmlRenderer->renderResponse(Array, Object, Object) (Line: 90)
Drupal\Core\EventSubscriber\MainContentViewSubscriber->onViewRenderArray(Object, 'kernel.view', Object)
call_user_func(Array, Object, 'kernel.view', Object) (Line: 111)
Drupal\Component\EventDispatcher\ContainerAwareEventDispatcher->dispatch(Object, 'kernel.view') (Line: 187)
Symfony\Component\HttpKernel\HttpKernel->handleRaw(Object, 1) (Line: 76)
Symfony\Component\HttpKernel\HttpKernel->handle(Object, 1, 1) (Line: 58)
Drupal\Core\StackMiddleware\Session->handle(Object, 1, 1) (Line: 48)
Drupal\Core\StackMiddleware\KernelPreHandle->handle(Object, 1, 1) (Line: 191)
Drupal\page_cache\StackMiddleware\PageCache->fetch(Object, 1, 1) (Line: 128)
Drupal\page_cache\StackMiddleware\PageCache->lookup(Object, 1, 1) (Line: 82)
Drupal\page_cache\StackMiddleware\PageCache->handle(Object, 1, 1) (Line: 48)
Drupal\Core\StackMiddleware\ReverseProxyMiddleware->handle(Object, 1, 1) (Line: 51)
Drupal\Core\StackMiddleware\NegotiationMiddleware->handle(Object, 1, 1) (Line: 51)
Drupal\Core\StackMiddleware\StackedHttpKernel->handle(Object, 1, 1) (Line: 704)
Drupal\Core\DrupalKernel->handle(Object) (Line: 18)