

Good times are coming for Ethereum as CFTC is prepared to give approval for Ethereum futures. Along these lines, the privilege to control the ethereal market for the CFTC will be executed in lawful terms, since now only coercive instruments are to be used.
Furthermore, exchanging non-deliverable ETH futures opens the doors for institutional investors to exchange Ether securely complying with all legal regulations.
How it might affect Ethereum price, and what are short-term ETH price predictions? TradingView experts have answers to these questions.
Rising wedge law still works - $198 is the next target
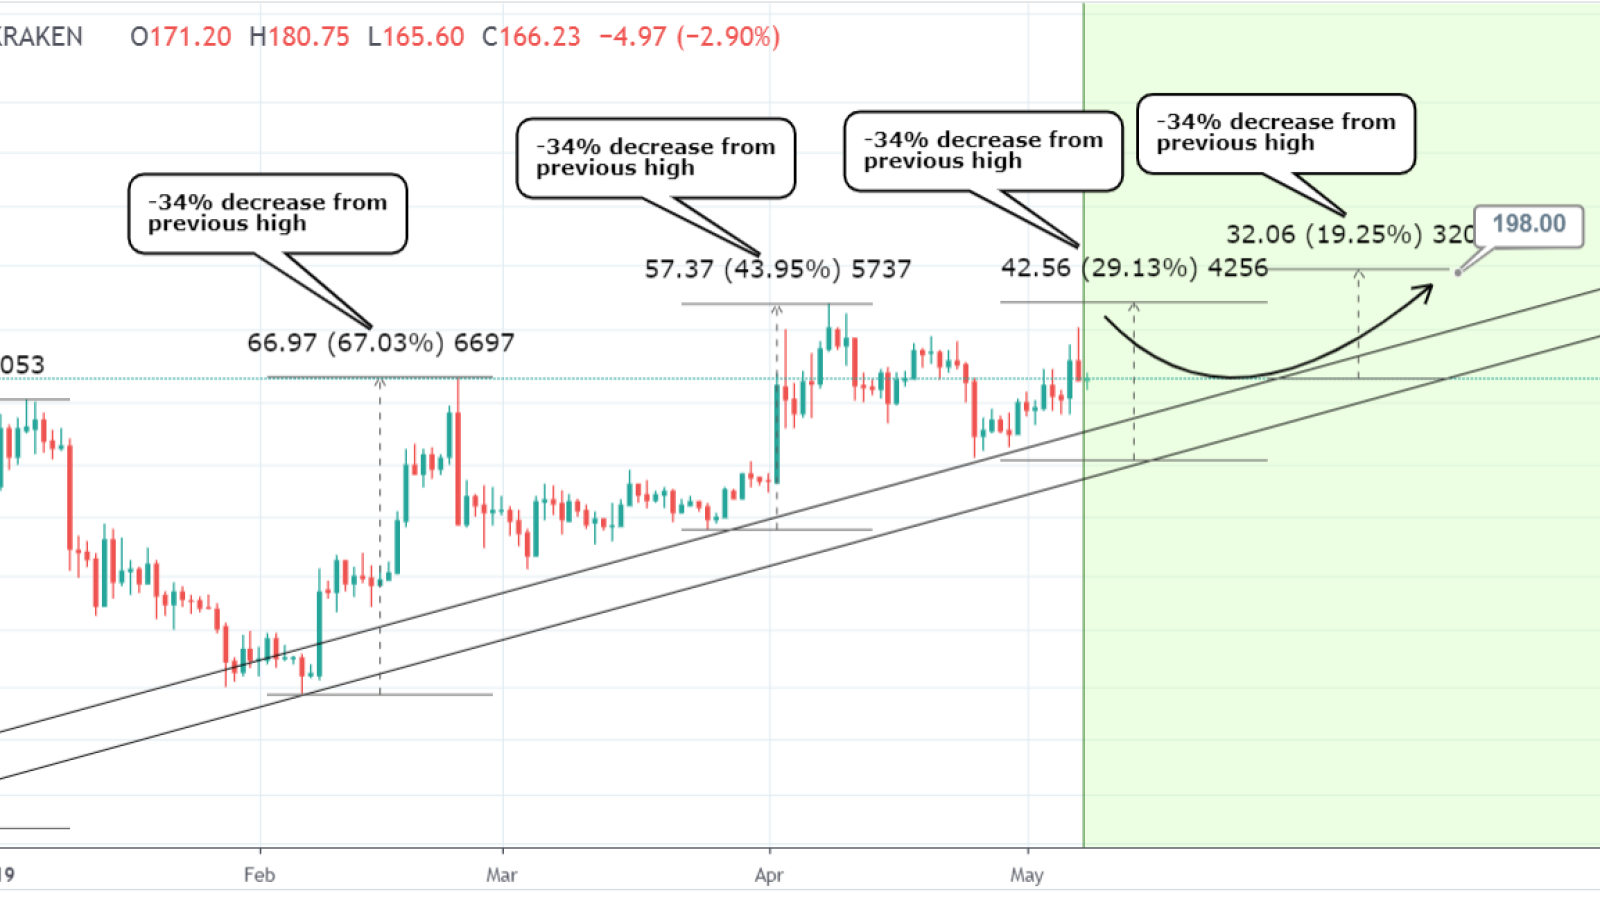
The user TradingShot has noticed one interesting peculiarity in ETH price chart: Ethereum is constantly on a rising wedge since it bottomed in December 2018.
Every top has a decreasing rate of -34%. This indicates a slow rise to $198.00 in June before ETH either pulls back for a final accumulation or breaks the Rising Wedge aggressively upwards.
The bullish structure is forming
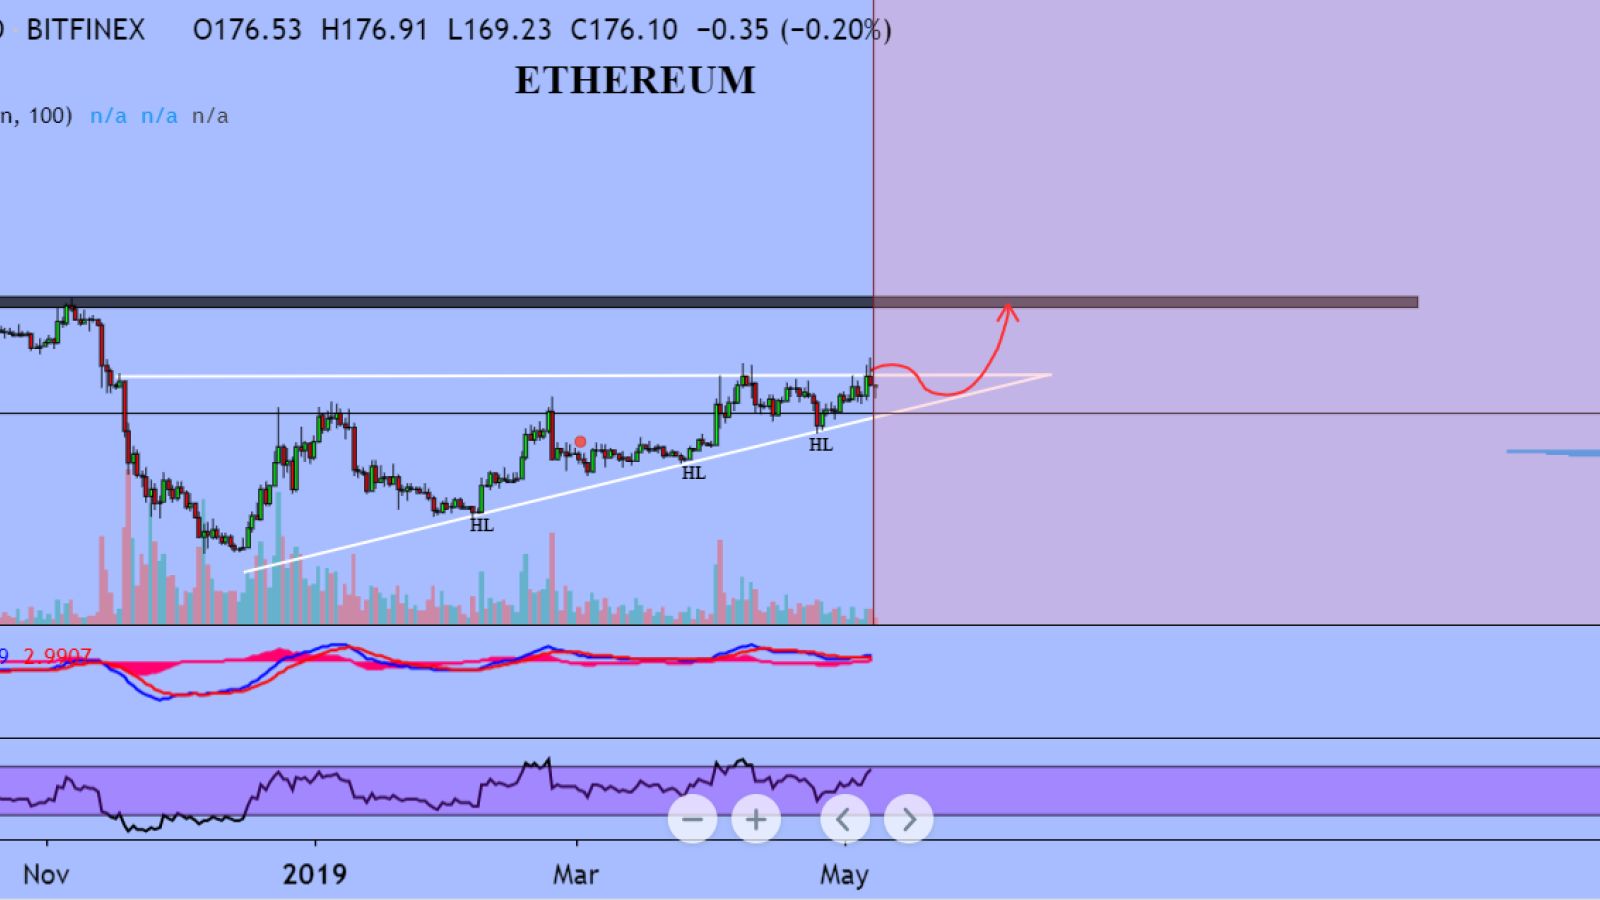
As we can see on this ETH price chart, several technical indicators also signify a serious ETH growth.
As for ETH/USD Short-term price analysis, there’s a neutral trading bias, and the 4H charts show a valid head and shoulders pattern, with bulls failing to negate the bearish pattern during the latest rally in the ETH/USD pair. The signals are mostly bearish and show us that it’s high time to sell.
Note that a bullish inverted head and shoulders pattern will form on the 4H time frame if the ETH/USD pair advances towards its current yearly trading high.
What about indexes on a short-term timeframe?
-
RSI indicator on the 4H time frame has also turned bearish and shows scope for further downside.
-
MACD Indicator has turned bearish, with the MACD signal line now issuing a sell signal.
As for the mid-term protections, the daily time frame is showing a small inverted head and shoulders pattern validated, while an even larger inverted head and shoulders pattern could take Ethereum move to reach $200.00 level.
Also, pay attention that the critical weekly support for Ethereum is around the $150.00 level. In the midterm, RSI Indicator on the daily time frame remains bullish, although downside pressures are building. MACD Indicator on the daily time frame is neutral, with the MACD histogram and the MACD signal line failing to issue clear trading signals.
Bulls are expected to make new higher price highs and push Ethereum above the $200.00 level by June, or the bearish pattern on the 4H chart could soon be triggered into action.
ETH is ready to explode?
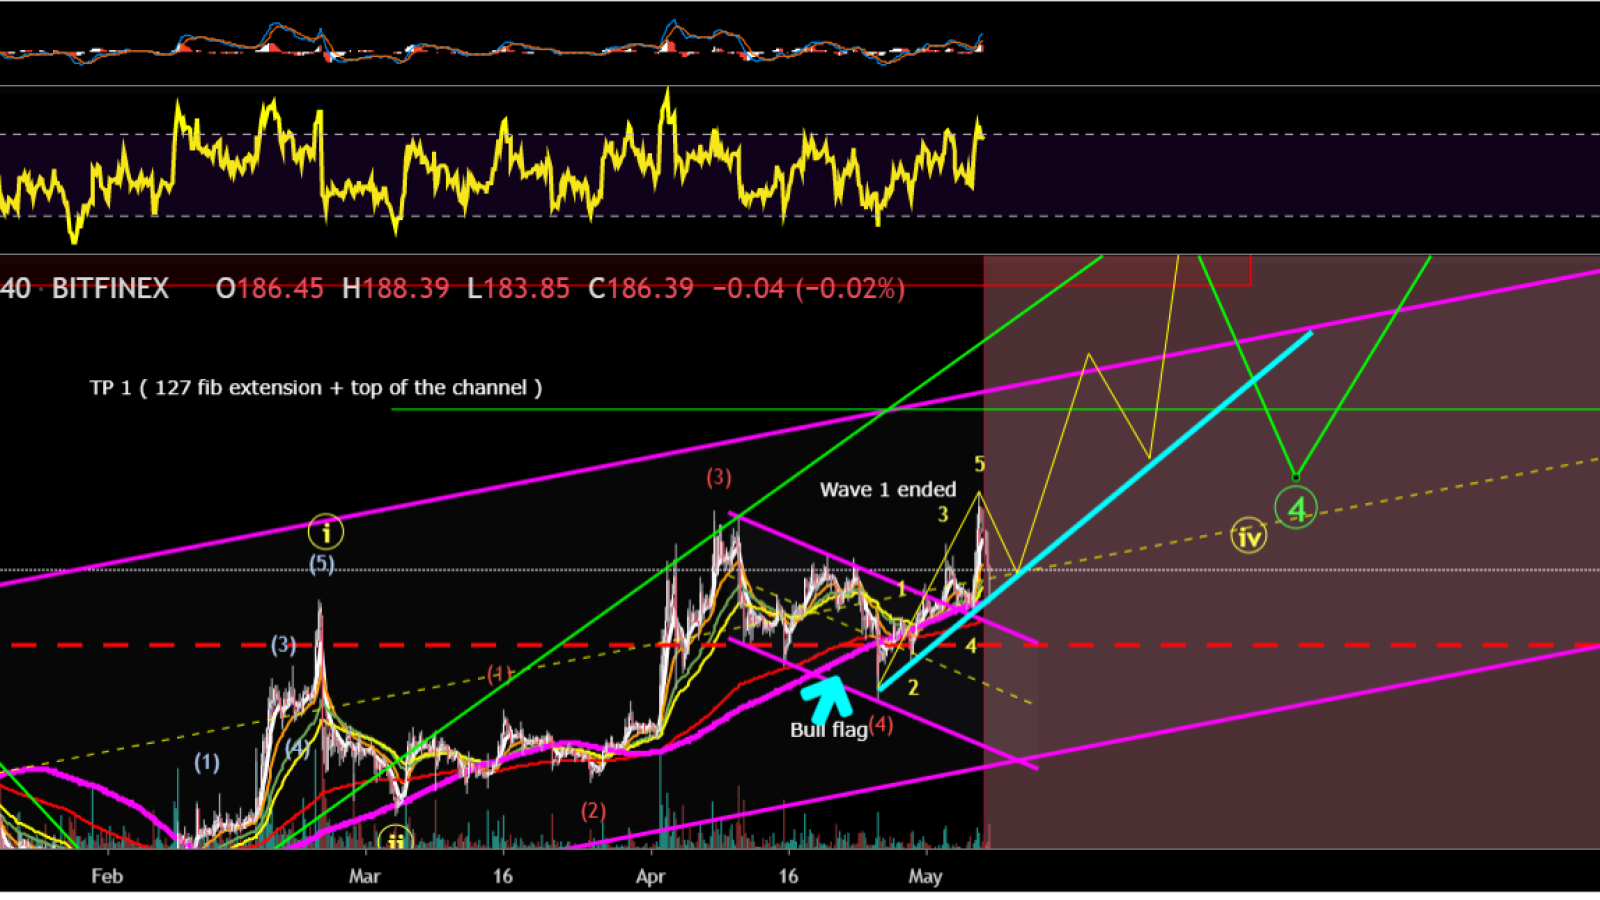
According to the analysis from MarioCryptoFib, Ethereum is ready to make an extended 5th wave of the third wave to reach the target. This cryptocurrency commonly follows the lead among the last ones. But there’s now long ETH support that established since 25th of April, so it has gathered enough power to explode the market on its 5th wave.
Final thoughts
Numerous specialists trust that permitting CFTC to exchange ETH futures will positively affect the destiny of digital money ETFs. Maybe the Securities Commission (SEC) will in any case issue a license to sort out assets sooner rather than later.
Since the last December, the CFTC started gathering data about Ethereum innovation and its application conceivable outcomes. The service said they mean to ponder in detail the gathered information so as to build up an administrative structure for directing the Ethereum advertise.
That means that after Ethereum’s rise to $200, its price can be pushed further higher thanks to the acceptance of Ethereum futures. However, no one can say for sure how much Ether can grow after that. Outcomes can be a humble 10% price rise, or some overwhelming +200-500% strike.
Price charts are taken from TradingView